Mar 25, 2025 / 6 minutes


Dry January Foot Traffic Trends: How Bars and Liquor Stores are Impacted
Dry January isn’t just a personal challenge anymore—it’s a movement that’s changing the way Americans consume (or don’t consume) alcohol. What started as a niche trend has gone mainstream, with more people than ever choosing to take a break from drinking at the start of the year. And that shift is making waves for businesses that rely on alcohol sales.
Bars and liquor stores, in particular, are feeling the impact, with changes in foot traffic that reflect evolving consumer habits. At dataplor, we dug into visitation patterns from December through February (2021-2025) to uncover the real story behind Dry January’s influence—spotting clear seasonal and regional trends that show just how much behavior is shifting.
Key Takeaways:
- 2025 saw the most widespread Dry January adoption, with all states showing a decline in bar and liquor store visits from December to January.
- Bars remain more resilient than liquor stores, likely due to their social atmosphere and non-alcoholic offerings.
- Certain states, like Maine and South Dakota, consistently show larger declines, reflecting stronger Dry January participation.
- Other states, such as New Mexico and Louisiana, displayed greater variability, suggesting that factors like local events and weather may play a role in foot traffic trends.
Seasonal Trends: The Rise of Dry January
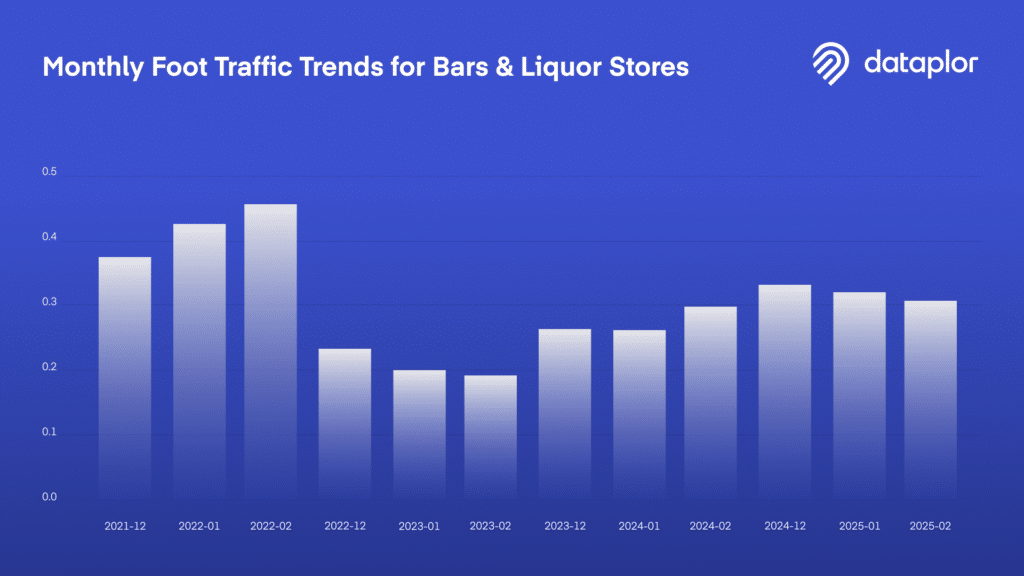
Analyzing month-over-month foot traffic for bars and liquor stores from December through February across multiple years (2021-2025) revealed several key patterns:
- There was no significant Dry January effect in 2021-2022, likely due to post-pandemic social activity boosting bar visits.
- 2022-2023 showed the first clear Dry January impact, with a noticeable drop in January and a slower recovery in February.
- 2023-2024 saw a similar January decline, but February rebounded quickly, suggesting only temporary behavior changes.
- 2024-2025 displayed a moderate drop in January, followed by a continued decline in February, indicating a sustained shift in drinking habits.
These trends suggest that Dry January has transitioned from a niche health challenge to a widely recognized movement affecting consumer behavior.
Bars vs. Liquor Stores: Who’s Getting Hit the Hardest?
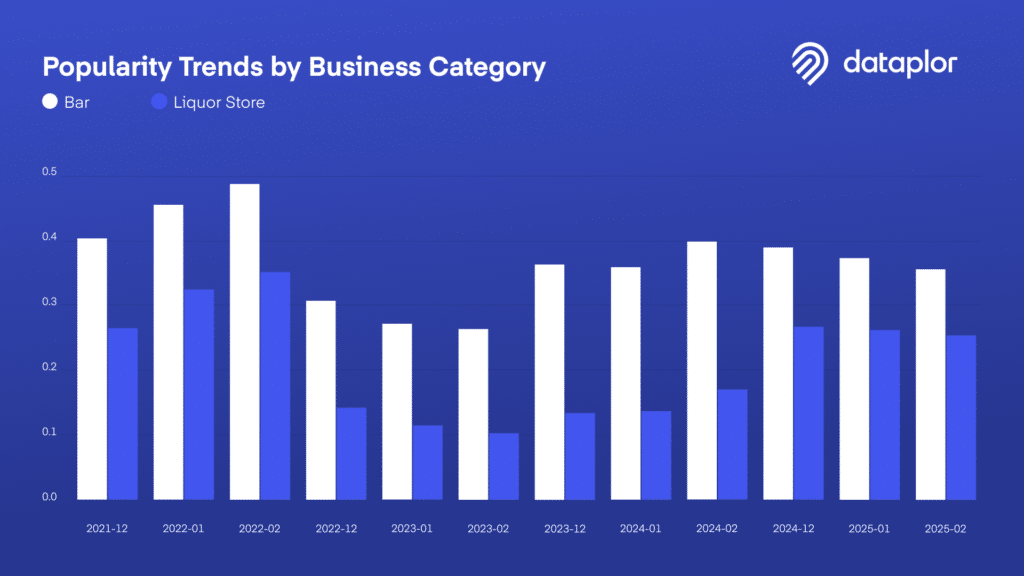
Comparing bar and liquor store visits over the December–February period highlights key differences in how these businesses are affected:
- Bars continue to attract more visitors and maintain steadier traffic throughout the winter months.
- Liquor stores peaked in early 2022 and have seen a decline since, with a slow recovery starting in late 2023.
- Bars show more resilience due to their diverse offerings, including food, social environments, and non-alcoholic beverage options.
- Liquor stores face greater volatility as consumers cut back on alcohol purchases during Dry January.
These findings indicate that while Dry January influences alcohol consumption, bars may weather the trend better than retail liquor stores.
Regional Trends: Dry January Adoption by State
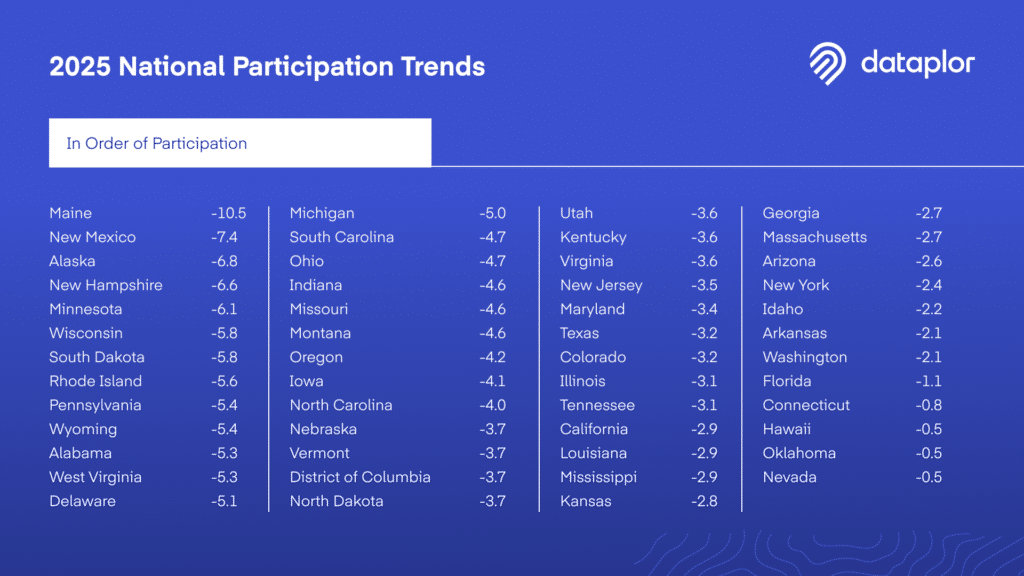
A state-by-state analysis of foot traffic changes from December to January reveals regional differences in Dry January participation:
- All states had bars and liquor stores that saw some level of decline, reinforcing the nationwide adoption of Dry January.
- Maine and South Dakota consistently experienced the largest drops, suggesting strong engagement in the movement.
- New Mexico, Louisiana, and Indiana showed more variability, likely due to local events, seasonal weather, or other external factors.
These variations highlight how Dry January adoption isn’t uniform across the U.S., with certain states embracing the trend more aggressively than others.
Year-Over-Year Growth: Is Dry January Here to Stay?
Analyzing four years (2022-2025) of state-by-state participation levels provides insight into Dry January’s growing influence:
- Maine consistently exhibited strong Dry January participation, with significant drops in bar and liquor store visits each year.
- 2025 marked the strongest and most widespread Dry January adoption, with every state showing declines in foot traffic.
- 2023 displayed trends similar to 2025, suggesting that Dry January participation has been steadily increasing.
As Dry January becomes more mainstream, bars and liquor stores may need to adapt their offerings to retain customers during this period. Given the sustained growth of Dry January, bars and liquor stores should consider new strategies to maintain customer engagement:
- Expand Non-Alcoholic Offerings – Many consumers are reducing alcohol intake but still want to socialize. Adding mocktails and premium non-alcoholic options can keep foot traffic steady.
- Promote Social Experiences – Bars that emphasize live music, trivia nights, and food pairings can attract customers who are abstaining from alcohol.
- Leverage Seasonal Promotions – Liquor stores may benefit from promoting Dry January-friendly options like non-alcoholic beer, wines, and spirits.
- Understand Regional Variations – Knowing how Dry January impacts different states can help businesses tailor their marketing efforts accordingly.
The numbers are in, and Dry January isn’t slowing down. In fact, 2025 marks the biggest year yet for participation. Bars are holding their own, thanks to their social draw, but liquor stores are seeing more ups and downs as consumers rethink their alcohol purchases.
Mobility data tells the full story, highlighting where and when these changes happen. For businesses, staying ahead means using these insights to refine their marketing strategies and adjust their approach. As Dry January continues to reshape the industry, those who pay attention to the trends will be the ones that thrive.