Leverage Location Data to Outsmart Your Competition
Mar 13, 2025 /


Leverage Location Data to Outsmart Your Competition
Imagine a fitness retailer launching a new line of running shoes. Instead of blanketing the city with generic ads, they use location intelligence to target their ideal customers.
By analyzing foot traffic data around parks, gyms, sporting goods stores, and competitor locations, they identify areas with a high concentration of runners and fitness enthusiasts. They then deploy hyperlocal digital ads and partner with local fitness influencers in those areas, creating buzz among their target audience, driving traffic to their stores, and maintaining a competitive edge in the market. This personalized experience isn’t magic; it’s the power of location analytics, a technology revolutionizing how businesses connect with customers.
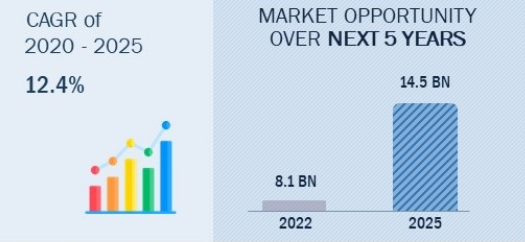
This isn’t “just another tech trend”. We’re witnessing an explosion in the industry, with the global location analytics market set to surge from $18.30 billion in 2023 to a staggering $64.85 billion by 2032, according to Fortune Business Insights.
Flying blind on location data is like navigating with your eyes closed. Companies that ignore these geographical insights are losing marketing dollars and watching their market share slip away to more savvy competitors.
However, businesses that harness location intelligence insights are transforming their operations, from optimizing customer engagement and streamlining logistics to mitigating risk and making informed expansion decisions.
In this article, we’ll reveal how forward-thinking companies use location analytics to leave their competition in the dust and how you can be more current with the industry’s demands. We’ll also explore how dataplor can empower your business with the accurate, comprehensive, and dynamic location data you need to succeed.
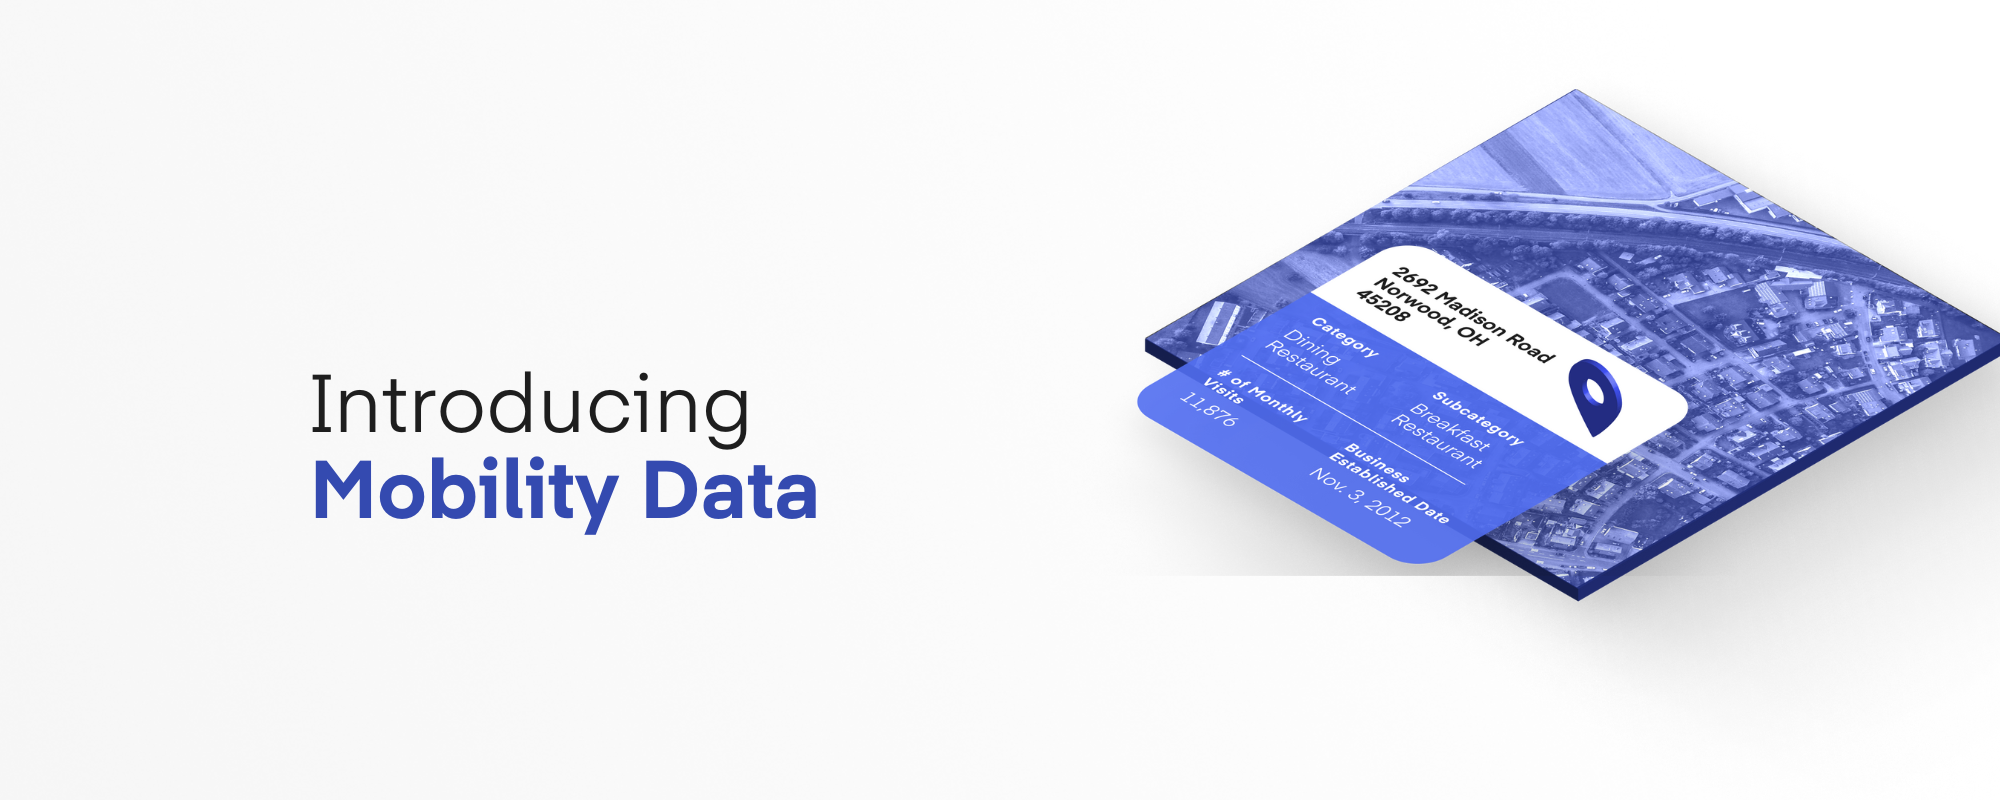
The Power of Localized Location Data
Imagine having a clear view of your customers’ visitation trends, along with detailed information about the businesses they visit—like hours of operation, location, and more. This is the power of location intelligence—a game-changing resource that empowers businesses to make data-driven decisions and achieve unprecedented growth.
Let’s explore how resourceful companies leverage location intelligence to transform customer connections, optimize operations, and gain a competitive edge in today’s dynamic marketplace.
Beyond Basic GPS
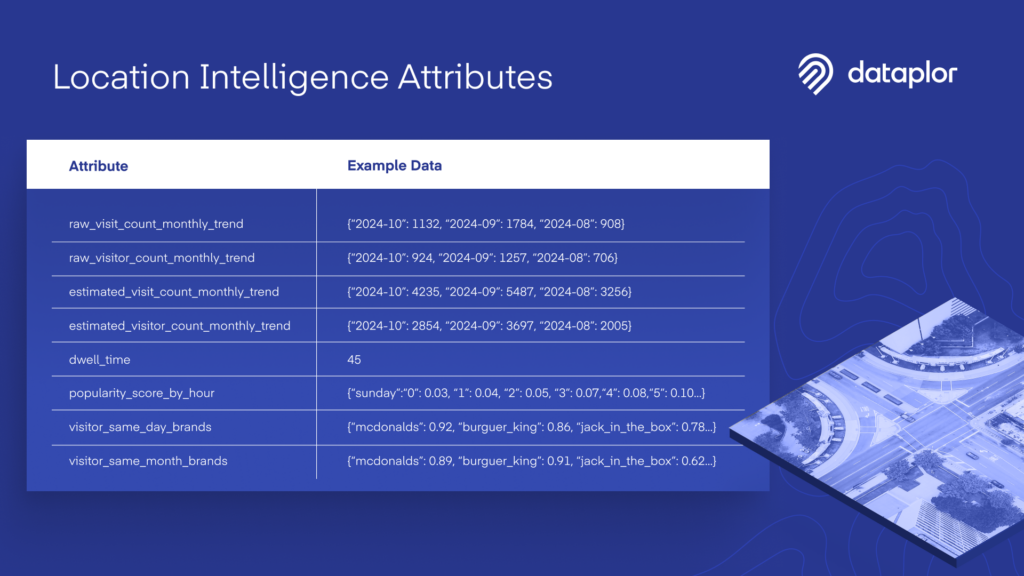
Traditional GPS coordinates only tell part of the story. Today’s location intelligence goes far beyond simple mapping, combining consumer visitation data with information on that specific business location. This empowers businesses to understand not just where customers visit, but key details about the business itself.
By leveraging location data, companies can track everything from foot traffic patterns and popular visiting times to how a business is performing. This granular level of detail unlocks a deeper understanding of target audiences and enables data-driven decision-making.
Consider your local shopping district. Location-based data reveals which stores attract the most visitors and how long they stay. These insights enable brands to craft targeted marketing campaigns that resonate with real-time customer preferences.
Use Cases
Let’s break down how different sectors use location-based marketing to revolutionize their operations.
Marketing and Sales
Location intelligence empowers marketers to go beyond broad demographics and understand the where and why of customer behavior. This insight allows for highly targeted campaigns that resonate with specific audiences.
Here’s how businesses can leverage location data to revolutionize their marketing and sales strategies:
- Identifying Prime Locations for Marketing Campaigns: By analyzing POI and mobility data, businesses can identify areas with a high concentration of their target audience. This allows them to focus their marketing efforts on the locations where they are most likely to be effective.
- Optimizing Advertising Spend: Location intelligence helps businesses understand where their ideal customers are visiting, allowing them to allocate their advertising budget more effectively. This ensures their message reaches the right people at the right time, maximizing ROI.
Operations
Location intelligence empowers businesses to optimize their operations, improve efficiency, and make data-driven decisions across various aspects of their business.
Here’s how companies can leverage location data to transform their operations:
- Optimizing Delivery Routes and Logistics: By analyzing road networks, high-traffic areas, and delivery destinations, businesses can optimize delivery routes and schedules, reducing transportation costs and improving delivery times.
- Strategic Site Selection and Expansion: Location intelligence helps businesses identify optimal locations for new stores, warehouses, or distribution centers based on factors such as competition, accessibility, and proximity to transportation hubs.
Risk Management
Location intelligence plays a crucial role in helping businesses assess and mitigate risks associated with specific locations. dataplor’s data empowers companies to make informed decisions and minimize potential threats to their operations and investments.
Here’s how businesses are leveraging location data for risk management:
- Assessing Investment Risks: Investors can use location data to analyze specific locations’ economic health and stability before making investment decisions. By understanding factors such as business survival rates, foot traffic patterns, and competitor activity, investors can gain valuable insights into the potential risks and rewards of investing in a particular area.
- Evaluating Market Suitability: Businesses can leverage location intelligence to evaluate the suitability of new markets before expanding their operations. By analyzing factors such as consumer behavior and competitor presence, companies can make informed decisions about market entry and reduce the risk of failure.
- Optimizing Security Measures: Location intelligence plays a crucial role in helping businesses assess and mitigate risks, particularly in the financial sector. By analyzing location data in conjunction with transaction patterns and customer behavior, companies can identify irregular or suspicious activities and enhance fraud detection capabilities.
How to Leverage Location Data to Beat the Competition
Navigating without location data is no longer enough. To truly outperform the competition, companies need to leverage location intelligence to drive strategic decision-making and operational efficiency.
By analyzing location-based insights, companies can refine their marketing strategies, optimize operations, and make data-driven decisions to maintain an edge.
Here’s how to use location data to outperform the competition.
Data-Driven Decision Making
Businesses need to make informed decisions based on accurate and timely data. Location intelligence empowers companies to move beyond guesswork and leverage real-time geographic insights to optimize strategies, identify opportunities, and allocate resources effectively.
For example, retailers can use location-based data to find gaps in the market, such as areas with high customer demand and no supply. By analyzing factors such as population density, customer visitation trends, competitor presence, and accessibility, businesses can pinpoint prime locations for new stores, distribution centers, or service areas.
In logistics, optimizing resources becomes easier with real-time location intelligence. By route planning, analyzing peak traffic times, and optimizing resource allocation, 3PL companies can eliminate inefficiencies and secure more business.
Location data provides valuable insights into customer behavior, allowing businesses to personalize their offerings and optimize customer experiences. For example, a restaurant chain can use location data to analyze peak visitation hours at different locations, ensuring adequate staffing levels to provide efficient service.
By using location data, businesses can gain a competitive edge, optimize operations, and make data-driven decisions that drive growth and profitability.
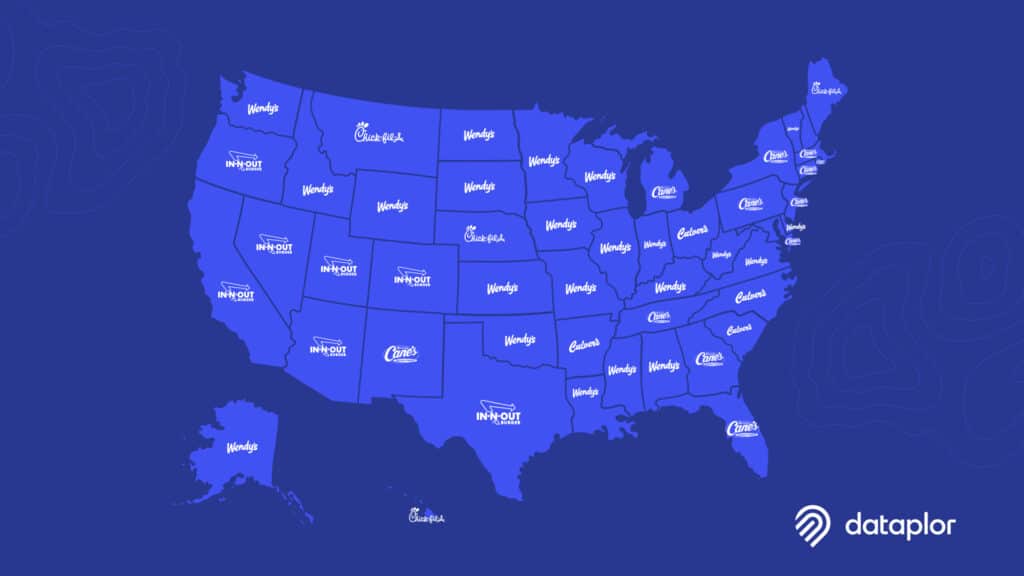
Competitive Analysis
Understanding your rival’s geographic footprint is crucial. Location intelligence empowers brands to go beyond surface-level observations and delve deeper into competitor activity, market share dynamics, and customer overlap. This analysis helps companies tailor content and services to underserved areas.
By mapping competitor locations against foot traffic patterns and points of interest, businesses can pinpoint underserved areas with high potential. For example, a fast food chain can analyze competitor locations and identify areas with a higher foot traffic but a limited presence of similar restaurants.
Market share analysis combined with location intelligence can show which businesses dominate certain areas. A retail brand might find that a competitor has a stronghold in urban areas but has a limited footprint in suburban markets. This location data can assist with expansion decisions to capture a larger market share.
Moreover, customer overlap analysis allows businesses to refine their marketing strategies. If two competing coffee shops share a significant portion of their audience, one can leverage location data to offer targeted promotions or loyalty programs to customers near their competitor’s location, enticing them to switch brands.
Using location data for competitive analysis, businesses can identify growth opportunities, develop targeted strategies, and ultimately outperform their rivals.
Personalized Customer Experiences
Delivering personalized customer experiences is key to building brand loyalty and driving customer engagement. Location data allows businesses to understand customer visitation trends and preferences, tailoring interactions and offerings for a more relevant and engaging customer journey.
Here’s how businesses can leverage location data to personalize the customer experience:
- Targeted Marketing and Promotions: By analyzing customer demographics, location data, and foot traffic patterns, businesses can create targeted marketing campaigns that resonate with specific customer segments. This ensures that marketing messages are relevant, timely, and delivered to the right audience.
- Tailored Recommendations: Understanding consumer behavior through location data allows businesses to provide more relevant product or service recommendations. By analyzing customer preferences in different locations, companies can tailor their offerings to meet their target audience’s specific needs and interests.
- Enhancing Customer Engagement: Location data can create more engaging and interactive customer experiences.
By using location-based insights, businesses can create stronger connections with their target audience, increase engagement, and boost conversion rates—all while delivering the most relevant content to individual customers.
Gain a Competitive Edge with dataplor’s Location Data
Leveraging location data is no longer optional—it’s a powerful tool for businesses looking to outsmart the competition. From optimizing marketing strategies to outpacing the competition, the right location-based data provides the insights needed to stay ahead.
At dataplor, we empower businesses to transform raw location data into actionable intelligence. Our cutting-edge technology and meticulous data verification processes ensure that you receive reliable and up-to-date information.
With dataplor’s location intelligence, you can make data-driven decisions that enhance customer engagement, optimize operations, and drive growth and profitability.
Ready to leverage location data for a competitive advantage?
Contact us today with any questions you may have, or request a free data sample to discover how dataplor can help you unlock the power of location-based data for your business.